A math toy by Pios Labs
When you click the "Play" button (the green button with the triangle pointing to the right), Chordinates! makes your equation and graph audible! It interprets your graph by moving from left to right along the x-axis, matching the y-value to a piano note, and playing it. You can stop playing the graph early, if you want. The particular sounds you hear are also affected by the options you choose below.
Modify your equation (or function) here. The equation will be in terms of x and y, corresponding to the x- and y-axes in the graph, or corresponding to time and pitch in the piano tune. You can modify the parameters of the equation by typing or clicking the little "up" and "down" buttons next to the parameters. If you want to change the type of equation to graph and hear, change the "Function Type" under Options below.
Change these settings to change what you will see and hear. You can change both mathematical and musical settings.
It's recommended to change the options in the order shown, from top to bottom. The musical scale option affects what default options you have for the graphing scales.
If you want to see the effect of different musical scales on how an equation sounds, remember to make sure your x- and y-scales are set to the same thing after you change musical scales. You might have to set custom graphing scales to make sure it's the same.
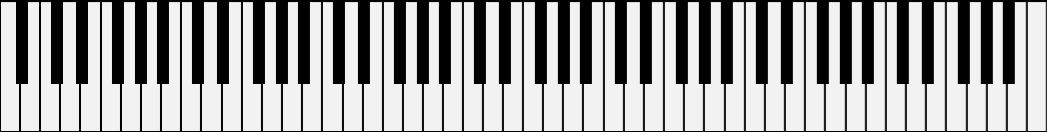
A grand piano traditionally has 88 keys, including both the black and white keys. You usually don't look at it sideways like this, but it's rotated vertically here, because every key on the piano is mapped to a y-value in the full vertical range of the 2D graph. The least y-value (at the bottom) corresponds to the lowest key on the piano keyboard (also at the bottom here, or on the far left on a real piano). Likewise, the maximum or greatest y-value (at the top) corresponds to the highest key on the piano keyboard (also at the top here, or on the far right of a real piano).
If the keys of a piano are considered evenly spaced apart, you can map all the y-values to a piano key. This is done by scaling the y-range to the piano key values -- on the chromatic scale (all the black and white keys), that's key numbers 1 to 88. If a value on the graph doesn't match exactly to a piano key, then you can round it up or down to the closest piano key. Just remember that these numbers only map to the key numbers on a piano, and not to the actual frequencies of note pitches, which is a whole other physics discussion!
You can also play the piano yourself by clicking on a piano key.
This is a traditional 2-dimensional coordinate plane, or Cartesian plane. The x-axis goes left and right, horizontally. The y-axis goes up and down, vertically. You can visualize an equation with x and y variables by plugging in numbers for one of those variables, and then seeing what the other variable has to be. Then you can plot those pairs of numbers here. The gray dots shown in this graph represent points when Chordinates! plays a piano note. A piano can only play certain notes, so we have to discretize the graph, or treat the graph like it was a series of points, and not a continuous line or curve.
This option changes the type of mathematical function or equation that will be displayed and made audible, in terms of x and y variables.
This option changes the set of possible notes that will play. By default, a C major scale is chosen, which consitutes all the white keys on the piano, with 7 different notes per octave. To get all the keys on the piano, both black and white, you can choose the chromatic scale, which has 12 notes per octave. Many other scales are possible, made up of some combination of black and/or white keys, that change the musical and emotional qualities of any sequence of notes. Try different scales to hear different moods. Scales with more notes per octave will also give you a higher resolution for hearing the coordinates making up an equation.
Chordinates! may also change the default x and y scales in the graph when you choose a new musical scale. The default graph scales are based on the simple linear equation y = x. The default graph scales try to make exactly one unit of movement across the x-axis correspond with one unit of movement across the y axis, or one new piano note.
This option changes the maximum and minum values shown in the graph for the x-axis. By default, the scale positions the origin of the graph horizontally approximately in the middle, so that both positive and negative x-values are shown.
This option changes the maximum and minum values shown in the graph for the y-axis. By default, the scale positions the origin of the graph vertically approximately at the middle of the piano, around middle C (piano key 40). If you set custom minimum and maximum values, the origin might move away from middle C, depending on what values you input.
This setting determines whether or not you want to play the equation with a steady beat or not. If you choose "regular" rhythm, then your browser will try its best to play the piano at a steady pace, every single beat. This like highlighting a point on your graph evenly along thex-axis, and Chordinates! could skip around the piano if the curve changes fast enough.
If you choose "free" rhythm, your browser will still analyze the graph steadily in time, but it will try to play a piano note whenever the equation crosses a value representing a piano note. In other words, it tries to play every cingle piano note, no matter how fast or slow they come up.
This option changes how your notes sound, in terms of texture, duration, dynamics, and color. Do you want a staccato, fast piano sound? Do you want a legato, lingering piano sound? Do you want a different instrument entirely?
This option determines whether or not you want to play certain musical intervals at every note. The root note will be the main piano note mapped to the math equation. Then another note or notes can play on top of the root note.
This option determines how fast the sonification plays. Slide it to the right to increase the speed (up to 200% of the default speed), and slide it to the left to decrease the speed (down to 20% of the original speed)..
This does not change the number of data points shown or heard in the graph. It only decreases the time between each note played. The number of notes played will remain the same.
This option determines how many notes will play per unit of x on the graph. Slide it to the right to incrase the sampling rate, which increases the density of data points on the graph that will be played as music. Slide it to the left to decrease the sampling rate, which decreases the density of data points that will be played as music.
This does not change the time between two notes. It only changes the number of notes pulled from the same graph. The time it takes to play the whole graph might change, because you will have a different number of notes to play.
Sheet music below! You can download a MusicXML file of this sheet music by clicking the button:
You can load MusicXML files into lots of music software and electronic musical instruments. You can also load the file up using this link to a cleaner page, for printing, screenshotting, etc.
Support Chordinates! and Pios Labs — Donate on Patreon